
Introducing Russula’s mathematical model for reheating furnaces
The furnace model developed by Russula gives a good estimation of material heating inside the furnace and is used to adjust heating requirements to optimize furnace combustion.
Russula has developed and implemented a mathematical model for reheating furnaces jointly with Vigo University. The furnace model gives a good estimation of material heating inside the furnace and is used to adjust heating requirements to optimize furnace combustion. This model is currently in operation at two furnaces after undergoing testing and validation.
The model complements the existing Russula reheating control modules including Level 1 control for combustion and logic, Level 2 for heating strategies and delay multipliers and a pyrometer feedback module. ArcelorMittal´s Vinton plant in Texas reduced energy consumption by 15.4%, from 1.5M to 1.3 M Btu´s per ton after implementing Russula´s Level 2 furnace control.
The complete set of Russula reheating furnace control programs result in effective furnace control, improving heating effectiveness and heating gas consumptions. Short pay-back times are obtained due to the effectiveness of furnace gas consumption reduction; reducing the cost per produced ton and results in an environmental impact by reducing atmospheric emissions.
Introduction
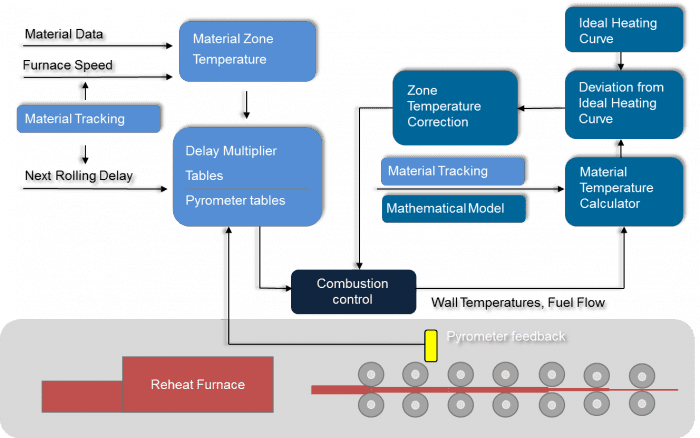
Russula has sponsored a chair and jointly developed a mathematical model for reheating furnaces with the Vigo University Applied Research Department (Universidade de Vigo). The model complements the existing Russula reheating control modules including Level 1 control for combustion and logic, Level 2 for heating strategies and delay multipliers and a pyrometer feedback module. An overview is shown in figure 1.
The Level 1 program is basic furnace control and includes two functions, combustion control and furnace logic. Combustion control is responsible for common regulation functions such as combustion air pressure control, furnace pressure control, gas pressure control and recuperator protection, furnace zone temperature control and cooling supervision functions. Furnace logic is the program that controls all charging, discharging, hydraulics and walking beam functions.
The Level 2 functions generate automatic heating set-points based on strategy tables and delay multiplier tables. A material (billets, blooms and slabs) tracking program is used at this control level (alternatively upon customer request the tracking program could be included as an option for the Level 1 function). The tracking program keeps track of all the material inside the furnace, detecting where different quality material is located, and decides, which heating strategy should be applied to a particular furnace control zone. This decision is based on material data information received from the operator or plant management software. Information regarding which strategy should be applied, and data regarding material speed inside the furnace are used to automatically generate set-points for zone temperature control automatic operation. Furnace stops are controlled by delay multiplier tables which generate the appropriate lower set-points if, for instance, a furnace stop is twice the average time between two furnace discharges.
The pyrometer feedback module corrects automatic temperature set-points for the heating and preheating furnace zones. This correction is based on pyrometer temperature feedback from the material after leaving the furnace, while it is rolling.
ArcelorMittal´s Vinton plant in Texas reduced energy consumption by 15.4%, from 1.5M to 1.3 M Btu´s per ton after implementing this Level 2 system. The project consisted of installing automatic set-points generation based on heating strategy and delay multipliers. This Level 2 temperature control generates temperature set points as a function of the product type and production velocity. The Level 2 system also automatically adjusts in function with various mill delay scenarios, saving on wasted gas when the mill is not in full production.
Mathematical Model
The reheating furnace mathematical model is a program intended to detect material temperature deviations inside the furnace against an ideal curve that could be supplied by the furnace constructor or optimised by the rolling mill personnel based on their experience and know-how. The program estimates material temperature for each product inside the furnace based on material speed, burner power and furnace temperatures. The estimated temperatures obtained are compared against an ideal curve and the deviation is used to calculate a correction for the furnace automatic temperature set-point generation system. The main objective of the program is to detect material heating deviations due to a lack of uniformity in material discharging that cannot be corrected by the delay multipliers control program and could lead to material overheating or under heating.
The Russula approach to develop the model began with static analysis of normal/standard operating conditions. In general, material temperature will be affected by initial conditions in addition to heating conditions. Heating conditions are determined by convection heat exchange between the material and the burnt gases inside the furnace, and the heat exchange with burner flames, furnace walls and other pieces of material through radiation. In the case of a walking hearth furnace, conduction heating between the furnace and the material pieces will have influence too. In general, heating conditions will be affected by:
- Product position inside furnace
- Flame temperature
- Gas temperature inside the furnace
- Furnace wall temperatures
- Material temperature
- Temperatures of other material, billets, slabs, inside the furnace
From the analysis a mathematically detailed simulation of furnace material heating under standard and stable heating conditions was produced. Main output data from this analysis are shown in figures 2, 3 and 4.
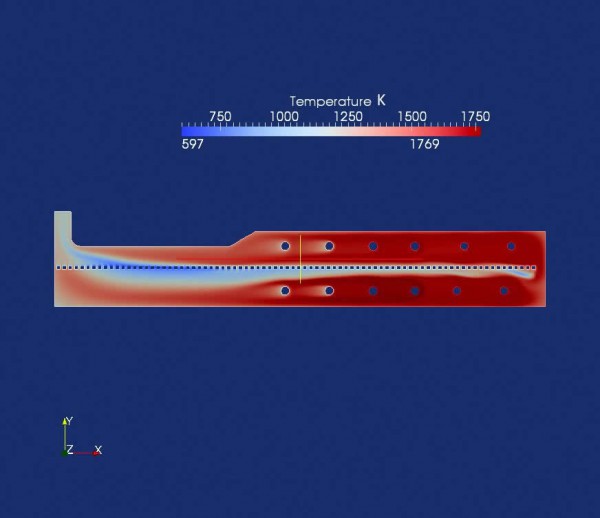
Figure 2 shows the result of a static analysis inside the furnaces with a gas temperature representation. One can see how the higher temperature gases are generated by the heating central burners. Also a gas flow analysis inside the furnace was conducted and showed how the gases flow from the burners to the gas exit. Gas temperatures close to the material pieces at the bottom and upper sides are also shown.
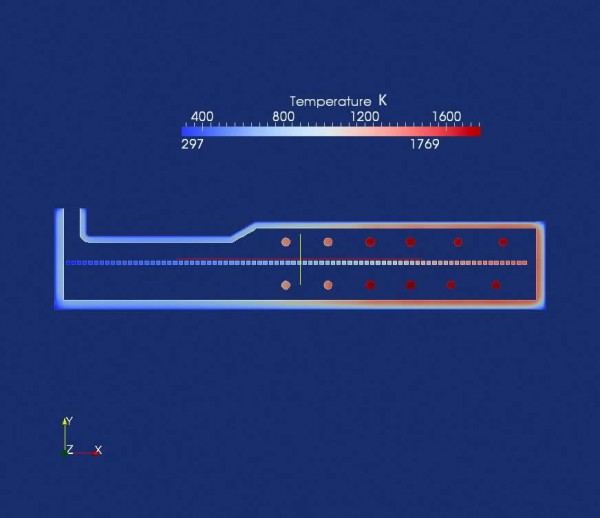
Figure 3 shows data related to the burner, furnace wall and material piece temperatures. Wall temperatures are the measured value of furnace thermocouples when properly installed on the furnace roof or walls. Furnace gas temperatures or burner temperatures are higher than the temperatures observed by furnace thermocouples on the roof or walls, as can be seen by comparing figures 2 and 3.
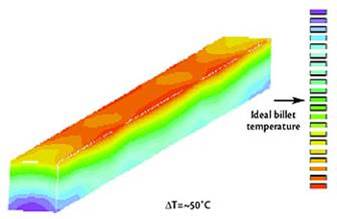
Figure 4 shows detailed data of one billet cross-section obtained from furnace static analysis. With the static analysis it is possible to analyze billet temperatures throughout the cross-section and compare, for instance, billet corners and centre.
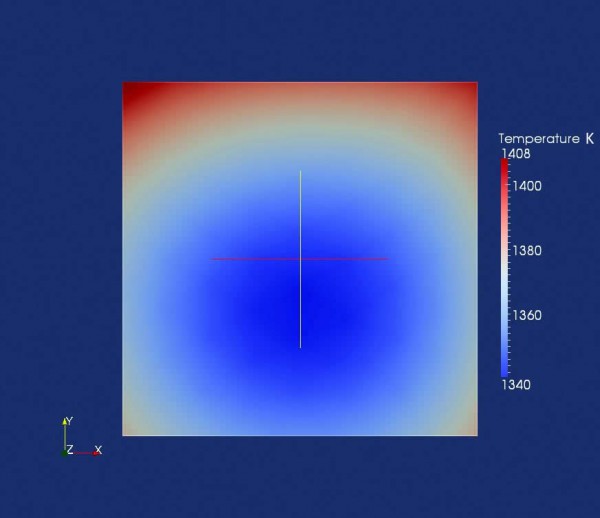
The static analysis is an intermediate step to construct the model; all obtained data must be analysed and checked to ensure that critical information regarding the furnace (geometrical data, burner power, walls, materials, etc.) is correct. Statistical data can also be confirmed with a material thermocouple test along the furnace.
The thermocouple test is a data recording operation where a data acquisition system collects all furnace parameters (temperatures, powers, set-points, waste gas temperature) and the data from several thermocouples installed on a test piece that goes through the furnace in a normal heating process. Continuous furnace operation is required to validate the data obtained from this test in order to be able to check the data with the static analysis output data.
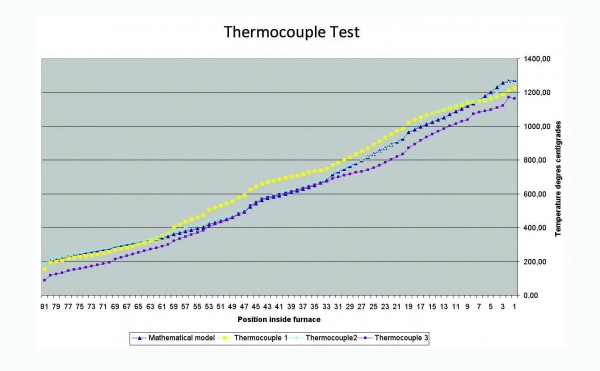
Static analysis is a complex mathematical process that requires hours of computer calculations, but from this, Russula has developed a simple modelling system based on the data obtained from the static analysis to furnace material temperature on-line independent of furnace speed and other heating parameters. The model predicts on-line, each minute, temperature for all material pieces inside the furnace. This data is compared with the ideal heating data and used to correct the automatic furnace set point generation program. Once again, the thermocouple test is a useful tool to check on-line material heating prediction. Figure 5 shows the different values obtained during a real test. Three thermocouples were installed in a billet; thermocouples 1 and 3 were located close to the billet ends and thermocouple 2 was installed in the middle. The mathematical model predictions show the billet at each position in the furnace.
A mathematical model must have a high repeatability; this means that results obtained under similar heating conditions must have similar temperature values. It is impossible to repeat the same heating and material speed conditions from one production day to the next on a real installation, but under similar conditions results obtained must be similar. Billet temperature differences between model estimation and thermocouple test values can be adjusted by offset adjustments, but it is absolutely necessary to get similar results against similar input conditions that lead to do an accurate automatic set point correction.
Figure 6 shows predictions of two different billets at different times under similar, but not equal production conditions. The same production speed, same final heating temperature target and same steel degree are the conditions for this test.
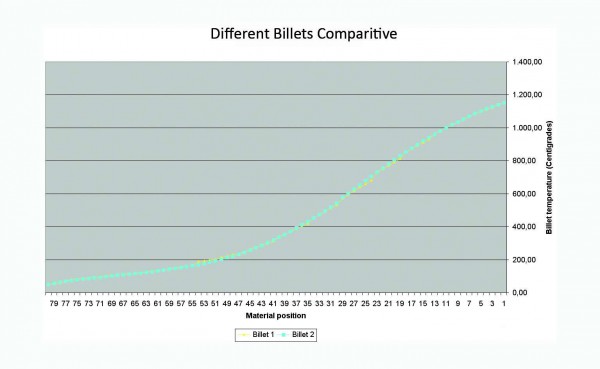
Figure 6 shows estimated temperature differences under similar production condition are lower than 10 ºC in various positions inside the furnace.
The furnace model gives a good estimation of material heating inside the furnace and is used to adjust heating requirements to optimize furnace combustion. This adjustment will finally result in improving of the heating process and will result in a positive economic impact by reducing the gas consumption in the furnace, reducing the cost per produced ton; and result in an environmental impact by reducing atmospheric emissions.
The complete set of Russula reheating furnace control programs result in effective furnace control, improving heating effectiveness and heating gas consumptions. Short pay-back times are obtained due to the effectiveness of furnace gas consumption reduction; especially at those installations without any previously existing optimization control program.